Based on https://github.com/iothon/docker-compose-mqtt-influxdb-grafana and https://lucassardois.medium.com/handling-iot-data-with-mqtt-telegraf-influxdb-and-grafana-5a431480217
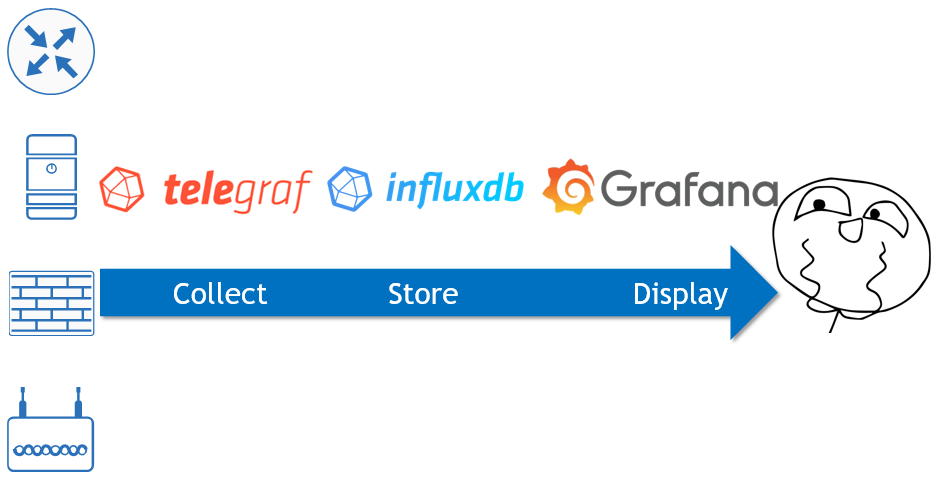
This docker compose installs and sets up:
- Eclipse Mosquitto – An open source MQTT broker to collect your data via MQTT protocol
- InfluxDB – The Time Series Data Platform to store your data in time series database
- Telegraf – The open source server agent to connect Mosquitto and InfluxDB together
- Grafana – The open observability platform to draw some graphs and more
Setup process
Install docker
sudo apt install docker.io
sudo apt install docker-compose
sudo usermod -aG docker iothon
Clone this repository
git clone https://github.com/Miceuz/docker-compose-mosquitto-influxdb-telegraf-grafana.git
Run it
To download, setup and start all the services run
cd docker-compose-mosquitto-influxdb-telegraf-grafana
sudo docker-compose up -d
To check the running setvices run
sudo docker ps
To shutdown the whole thing run
sudo docker-compose down
Test your setup
Post some messages into your Mosquitto so you’ll be able to see some data in Grafana already:
sudo docker container exec mosquitto mosquitto_pub -t 'paper_wifi/test/' -m '{"humidity":21, "temperature":21, "battery_voltage_mv":3000}'
Grafana
Open in your browser: http://<your-server-ip>:3000
Username and pasword are admin:admin. You should see a graph of the data you have entered with the mosquitto_pub command.
InfluxDB
You can poke around your InfluxDB setup here: http://<your-server-ip>:8086 Username and password are user:password1234
Configuration
Mosquitto
Mosquitto is configured to allow anonymous connections and posting of messages
listener 1883
allow_anonymous true
InfluxDB
The configuration is fully in docker-compose.yml. Note the DOCKER_INFLUXDB_INIT_ADMIN_TOKEN – you can run a test with the one given, but you better re-generate it for your own security. This same token is repeated in several other config files, you have to update it there also. I did not find an easy way to generate it automagically in docker yet. Change it before you go live. You have been warned. Also change the username and password.
  influxdb:
    image: influxdb
    container_name: influxdb
    restart: always
    ports:
      - "8086:8086"
    networks:
      - iot
    volumes:
      - influxdb-data:/var/lib/influxdb2
      - influxdb-config:/etc/influxdb2
    environment:
      - DOCKER_INFLUXDB_INIT_MODE=setup
      - DOCKER_INFLUXDB_INIT_USERNAME=user
      - DOCKER_INFLUXDB_INIT_PASSWORD=password1234
      - DOCKER_INFLUXDB_INIT_ORG=some_org
      - DOCKER_INFLUXDB_INIT_BUCKET=some_data
      - DOCKER_INFLUXDB_INIT_ADMIN_TOKEN=4eYvsu8wZCJ6tKuE2sxvFHkvYFwSMVK0011hEEiojvejzpSaij86vYQomN_12au6eK-2MZ6Knr-Sax201y70w==
Telegraf
Telegraf is responsible for piping mqtt messages to influxdb. It is set up to listen for topic paper_wifi/test. You can alter this configuration according to your needs, check the official documentation on how to do that. Note the InfluxDB token you have to update.
[[inputs.mqtt_consumer]]
  servers = ["tcp://mosquitto:1883"]
  topics = [
    "paper_wifi/test/#"
  ]
  data_format = "json"

[[outputs.influxdb_v2]]
  urls = ["http://influxdb:8086"]
  token = "4eYvsu8wZCJ6tKuE2sxvFHkvYFwSMVK0011hEEiojvejzpSaij86vYQomN_12au6eK-2MZ6Knr-Sax201y70w=="
  organization = "some_org"
  bucket = "some_data"
Grafana data source
Grafana is provisioned with a default data source pointing to the InfluxDB instance installed in this same compose. The configuration file is grafana-provisioning/datasources/automatic.yml. Note the InfluxDB token you have to update.
apiVersion: 1

datasources:
  - name: InfluxDB_v2_Flux
    type: influxdb
    access: proxy
    url: http://influxdb:8086
    jsonData:
      version: Flux
      organization: some_org
      defaultBucket: some_data
      tlsSkipVerify: true
    secureJsonData:
      token: 4eYvsu8wZCJ6tKuE2sxvFHkvYFwSMVK0011hEEiojvejzpSaij86vYQomN_12au6eK-2MZ6Knr-Sax201y70w==
Grafana dashboard
Default Grafana dashboard is also set up in this directory: grafana-provisioning/dashboards